Troubleshoot WMI high
CPU usage issues
·
Article
·
06/01/2023
·
4 contributors
Feedback
In this article
3. Analyze
the incoming queries
4. Find
the client PIDs that causing high CPU usage
This
article covers how to diagnose Windows Management Instrumentation (WMI) high
CPU usage issues on any Windows operating system.
Identify the problem
In
most scenarios, the CPU is consumed by the WmiPrvse.exe process,
and there are a few instances where svchost.exe hosting the
WMI service (Winmgmt) is consuming high CPU usage.
Review the Task Manager's Processes pane or
Details pane to identify the exact process
Identify
if the process is WmiPrvse.exe or svchost.exe (hosting
the WMI service Winmgmt), and identify the process ID.
Note
You may have to
manually add the PID column to view the process ID of all the
processes in Task Manager.
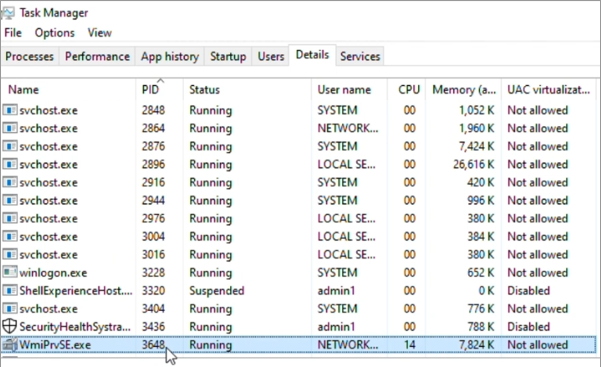
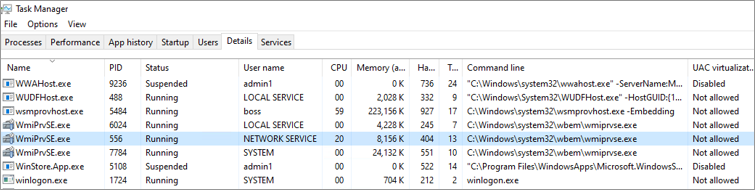
Here's
an example. Go to Task Manager > Details, then
sort by Name and locate the WmiPrvse.exe process
that's consuming high CPU usage. Make a note of the process ID (PID).
This
screenshot shows multiple instances of WMI Provider Host (the WmiPrvse.exe process)
as active and its CPU utilization.
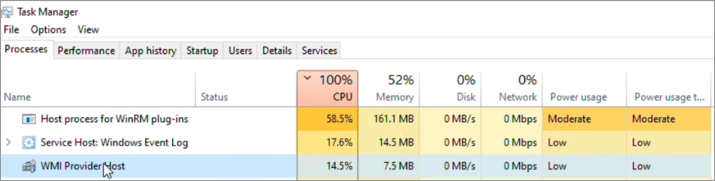
This
screenshot shows Services Host: Windows Management Instrumentation (svchost.exe hosting
the Winmgmt service) and its CPU utilization.
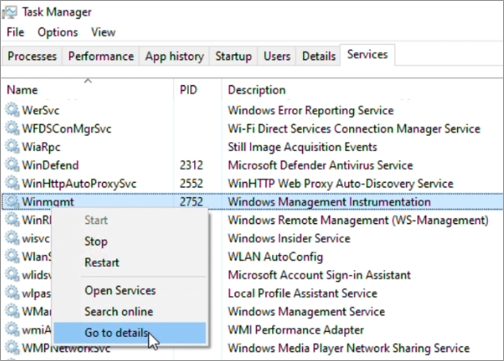
Go
to Task Manager > Services, sort by Name,
and locate the Winmgmt service. Make a note of the PID. Right-click the service
and select Go to details to locate the svchost.exe process
as follows:
In
the example, out of three WmiPrvse.exe instances, PID 3648 is
located, which consumes around 25% of CPU usage. Winmgmt is hosted under
the svchost.exe process with PID 2752.
Understand the CPU consumption
This
involves mainly observing the overall CPU consumption and the PID identified.
It's important to note when, how, and the frequency of the CPU consumption.
Assess
the situation by understanding if the CPU consumption is high during a specific
time. Check if there's any activity, such as running specific tasks or services
active, running monitoring applications, or running scripts leading to WmiPrvse.exe or
Winmgmt high CPU.
Understand
if there's any pattern, which means CPU usage is consistent, inconsistent,
random, sporadic, or has regular spikes.
Identify
the frequency of the CPU consumption. Check if it occurs only during production
hours, out-of-business hours, or a random time of the day. It may also occur
during a specific activity like user sign in or sign out.
You
may use Task Manager and visually make a note of how the CPU usage pattern is.
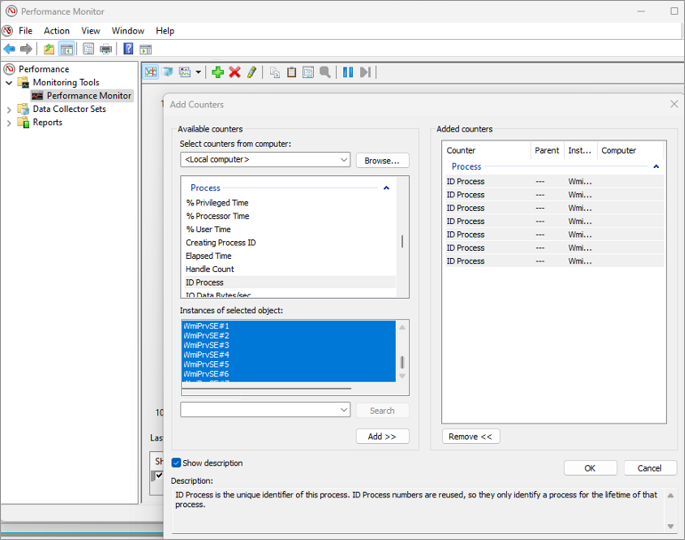
Here's
an example that shows how to use the Performance Monitor (Perfmon) tool to
identify the exact instances of WmiPrvse.exe with the PID you
identified. You can also get a graphical view of the CPU consumption of any
process (WmiPrvse.exe or svchost.exe hosting WMI
service).
1.
Open an elevated
command prompt, and enter Perfmon.
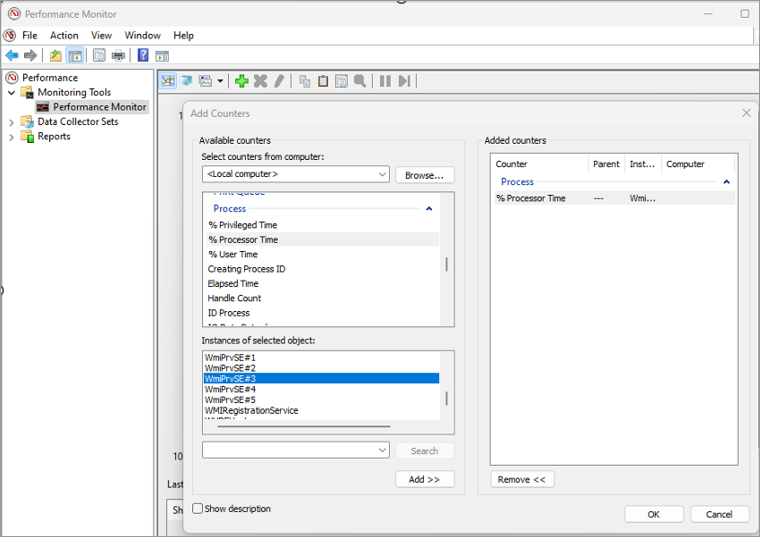
2.
Select Performance
Monitor in the left pane, and select the plus sign (+) in the
right pane to open the Add Counters window.
3.
Expand Process and
select ID Process. Select all the WmiPrvse# instances,
and then select Add > OK.
4.
In the Add
Counters window, expand Process and select %Processor
Time. Select the WmiPrvse# matching the PID consuming high
CPU usage, and then select Add > OK.
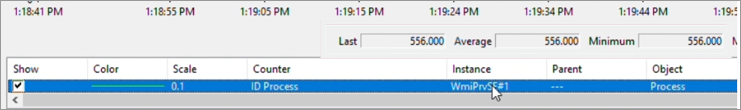
5.
For the "ID
Process" counter, the Last, Average, Minimum,
and Maximum all represent the PID of the respective WmiPrvse.exe process.
Once you have identified the exact instance that's consuming high CPU usage,
you may remove the remaining instances of WmiPrvse# instances
from the list by pressing Delete.
In
the example, it's noted that WmiPrvse.exe PID 556 was
consuming high CPU usage, and it's WmiPrvse#1 that matches PID
556 in Performance Monitor.
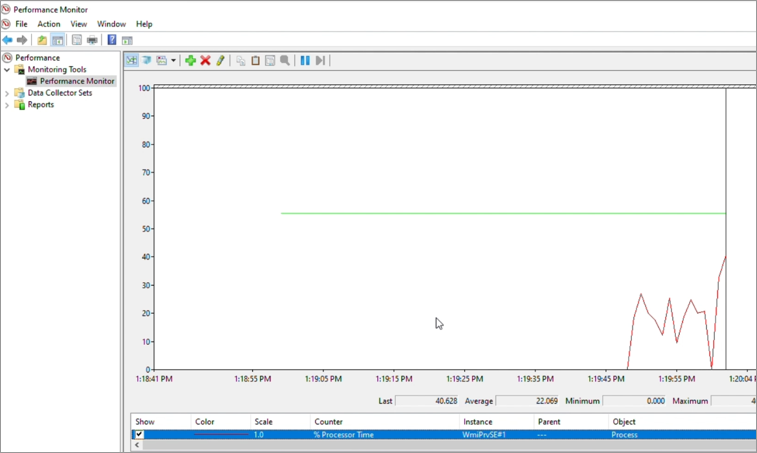
Then
counter %Processor Time of WmiPrvse#1 is
added to see a live graphical view of the CPU usage of this process. In the
example, the %Processor Time color of WmiPrvse#1 is
changed from yellow to red.
The
steps are the same for locating the right svchost# in
Performance Monitor in the case of high CPU usage by svchost.exe hosting
the Wmimgmt service.
If
you observe that a svchost.exe process hosting the WMI service
is causing high CPU usage and suspect that WMI is contributing to the issue,
you can confirm if the PID of the svchost.exe process is
hosting the WMI service by running the following command:
ConsoleCopy
tasklist /svc /fi
"Services eq Winmgmt"
If
the svchost.exe process contains multiple services, you can
break apart the WMI service into its own svchost.exe process
by following these steps:
1.
Open an elevated
command prompt with elevated privileges.
2.
Run the following
command:
ConsoleCopy
sc config Winmgmt type= own
3.
Restart the WMI
service.
After
restarting the service, you may run the Tasklist /svc command to check if the Winmgmt service
is running under its own svchost.exe process.
After
resolving the issue or no longer requiring the service to be in its own svchost.exe process,
you can place it back into the shared svchost.exe process. You
can perform the action by running the following command from a command prompt
and then restarting the WMI service again:
ConsoleCopy
sc config Winmgmt type= share
Diagnose WmiPrvse.exe
So
far, you only have the exact PID of WmiPrvse.exe that's
consuming high CPU usage. Next, gather as much information as possible about
this PID. This helps you assess the situation or identify something that could
be causing the problem. Gather information on other resource usage or identify
the exact WMI provider (DLL) hosted by the WmiPrvse.exe PID
identified.
Other resource usage such as memory, handles,
threads, and username
Gather
information on other resource usage, such as memory, handles, threads, and
username, at the time of high CPU usage. You may use the Details tab
in Task Manager, select the exact PID, and review it.
Note
Add additional columns
as needed.
Identify the exact WMI provider (DLL) hosted
by the WmiPrvse.exe PID identified
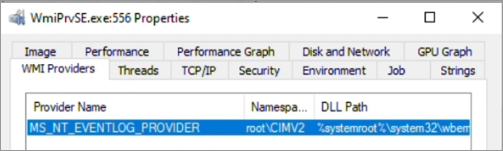
Process
Explorer can help you identify the exact providers hosted in the PID
identified. Follow these steps:
1.
Run Process Explorer
as administrator. Locate the identified WmiPrvse.exe PID, go
to its properties, and select the WMI Providers tab.
2.
In the following
example, WmiPrvse.exe PID 556 is located and found to be
hosting:
·
WMI provider: MS_NT_EVENTLOG_PROVIDER
·
Namespace: root\CIMV2
·
DLL path: %systemroot%\system32\wbem\ntevt.dll
In
most cases, there may be more than one provider loaded. It may be any of the
providers that are spending time in the CPU, causing high CPU issues.
Sometimes,
if the issue is intermittent or infrequent, the WmiPrvse.exe causing
the issue may be terminated over time. When the issue occurs again, it may be
the same provider(s) in a new WmiPrvse.exe instance. In this
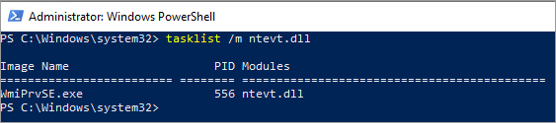
situation, once you have the provider(s) noted, run the following cmdlet to
show the current PID of the WmiPrvse.exe process containing
that provider:
PowerShellCopy
tasklist /m <Provider
DLL>
Here's
an example:
PowerShellCopy
tasklist /m ntevt.dll
Currently,
the output shows that the CIMWin32.dll provider is loaded in
two different WmiPrvse.exe instances and their PIDs.
Hence,
it's important to understand what providers are loaded in the WmiPrvse.exe process
and make a note of the PID of the WmiPrvse.exe process every
time.
Once
you have the provider(s) that are loaded in the WmiPrvse.exe causing
high CPU usage, you can understand if it's handling any tasks.
Tasks
may be the incoming WMI queries that are submitted by the client process to the
WMI service, which then is assigned to the appropriate WMI provider process. In
the example, the task is submitted to the MS_NT_EVENTLOG_PROVIDER provider. So the next step will be to
study the incoming queries and tasks to the MS_NT_EVENTLOG_PROVIDER provider.
Analyze the incoming queries
Examining
incoming queries involves:
·
Identifying WMI
query(s) that are handled by WMI providers causing high CPU usage.
·
WMI class(es) queries.
·
An associated user.
·
A client process
that's initiating the query.
The
above information can be gathered using the publicly available tool WMIMon or WMI-Activity
Operational logs and WMI-Tracing available under Event Viewer.
Operational logs:
Microsoft-Windows-WMI-Activity/Operational
The
incoming queries are logged as operational events in the
Microsoft-Windows-WMI-Activity/Operational log, which is available under:
Event Viewer > Applications
and Services Logs > Microsoft > Windows > WMI-Activity
There
are several types of events logged.
If
the WmiPrvse.exe process consuming high CPU is terminated from
time to time, and you already know what provider(s) are loaded, the following
event may help determine the currently active WmiPrvse.exe process
hosting the provider in question.
OutputCopy
Log Name: Microsoft-Windows-WMI-Activity/Operational
Source: Microsoft-Windows-WMI-Activity
Event ID: 5857
Task Category: None
User: NETWORK SERVICE
Description:
MS_NT_EVENTLOG_PROVIDER
provider started with result code 0x0. HostProcess = wmiprvse.exe; ProcessID =
556; ProviderPath = %systemroot%\system32\wbem\ntevt.dll
Enable "Analytic and Debug Logs" for
enabling the WMI tracing
In Event
Viewer, select View > Show Analytic and Debug
Logs to enable the Debug and Trace for
WMI-Activity.
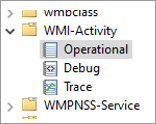
Debug and Trace are
disabled by default, and each of them can be enabled manually by
right-clicking Trace or Debug and then
selecting Enable Log.
Note
Enabling Show
Analytic and Debug Logs enables debug and tracing for almost all the
event sources and creates additional logging. Hence this has to be disabled
once the investigation is complete and will not be in use anymore.
This
tracing can be kept enabled while you observe high CPU consumption by the WmiPrvse.exe process
or long enough to capture the behavior of high CPU usage to keep the logs clean
and moderately sized for easier analyzing of traces.
1.
Export the traces by
right-clicking Trace and selecting Save All Events As….
2.
Select .xml or .csv in Save as type.
Note
You may choose other familiar formats such as .EVTX as needed.
3.
Choose the desired
language of the tracing file.
4.
You may choose to save
the WMI-Activity Operational events separately as well, in the desired format
for you to review and analyze.
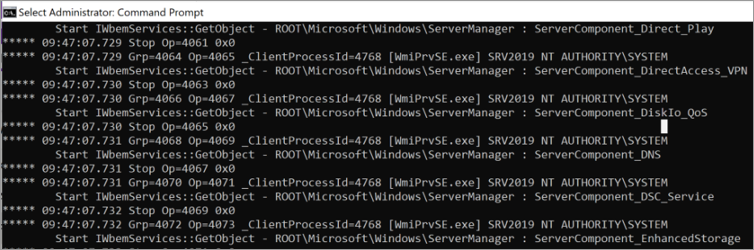
Review the WMI trace files
Within
the WMI tracing, there are multiple important operations included, which are
all part of incoming WMI queries. The operations are documented in IWbemServices
interface (wbemcli.h).
Some
of the important operations are:
·
IWbemServices::ExecQuery method (wbemcli.h)
·
IWbemServices::ExecMethod method (wbemcli.h)
·
IWbemServices::ExecQueryAsync method (wbemcli.h)
Here's
one of the log entries from the WMI-Tracing CSV file saved:
|
Level |
Date and time |
Source |
Event ID |
Task category |
Description |
|
Information |
05-05-23 14:48 |
Microsoft-Windows-WMI-Activity |
11 |
None |
CorrelationId = {345E5566-0000-0000-0000-68343241D901};
GroupOperationId = 30693; OperationId = 30694; Operation = Start
IWbemServices::ExecQuery - root\cimv2 : select * from Win32_Product;
ClientMachine = 21H2W10M; User = CONTOSO\<UserName>; ClientProcessId =
5484; NamespaceName = 133277000000783520 |
A
similar event in XML format looks like:
XMLCopy
<Event xmlns="http://schemas.microsoft.com/win/2004/08/events/event">
<System>
<Provider Name="Microsoft-Windows-WMI-Activity" Guid="{1418ef04-b0b4-4623-bf7e-d74ab47bbdaa}"/>
<EventID>11</EventID>
<Version>0</Version>
<Level>4</Level>
<Task>0</Task>
<Opcode>0</Opcode>
<Keywords>0x8000000000000000</Keywords>
<TimeCreated SystemTime="2023-05-05T13:09:18.7442455Z"/>
<EventRecordID>112</EventRecordID>
<Correlation ActivityID="{eddc1bfb-0000-0000-0000-18b6cabf5949}"/>
<Execution ProcessID="2752" ThreadID="4132"/>
<Channel>Microsoft-Windows-WMI-Activity/Trace</Channel>
<Computer>21H2W10M.contoso.com</Computer>
<Security UserID="S-1-5-18"/>
</System>
<UserData>
<Operation_New xmlns="http://manifests.microsoft.com/win/2006/windows/WMI">
<CorrelationId>{345E5566-0000-0000-0000-67343241D901}</CorrelationId>
<GroupOperationId>28089</GroupOperationId>
<OperationId>28090</OperationId>
<Operation>Start
IWbemServices::ExecQuery - root\cimv2 : select * from Win32_Product</Operation>
<ClientMachine>21H2W10M</ClientMachine>
<ClientMachineFQDN>21H2W10M.contoso.com</ClientMachineFQDN>
<User>CONTOSO\<UserName></User>
<ClientProcessId>5484</ClientProcessId>
<ClientProcessCreationTime>133277000000783520</ClientProcessCreationTime>
<NamespaceName>\\.\root\cimv2</NamespaceName>
<IsLocal>true</IsLocal>
</Operation_New>
</UserData>
<RenderingInfo Culture="en-US">
<Message>CorrelationId =
{345E5566-0000-0000-0000-67343241D901}; GroupOperationId = 28089; OperationId =
28090; Operation = Start IWbemServices::ExecQuery - root\cimv2 : select * from
Win32_Product; ClientMachine = 21H2W10M; User = CONTOSO\<UserName>; ClientProcessId = 5484;
NamespaceName = 133277000000783520</Message>
<Level>Information</Level>
<Task/>
<Opcode>Info</Opcode>
<Channel/>
<Provider>Microsoft-Windows-WMI-Activity</Provider>
<Keywords/>
</RenderingInfo>
</Event>
From
the above sample operation output, you can get and understand the following
information:
·
A query was initiated
on: 2023-05-05 at 13:09:18
·
On machine: 21H2W10M,
·
From a client PID:
5484
·
Operation ID: 28089
·
Query: select * from Win32_Product
·
Namespace: \\.\root\cimv2
·
Operation: IWbemServices::ExecQuery
Here's
another log:
|
Level |
Date and time |
Source |
Event ID |
Task category |
Description |
|
Information |
05-05-23 14:47 |
Microsoft-Windows-WMI-Activity |
12 |
None |
ProviderInfo for GroupOperationId = 30641; Operation =
Provider::CreateInstanceEnum - MS_NT_EVENTLOG_PROVIDER : Win32_NTLogEvent;
HostID = 556; ProviderName = MS_NT_EVENTLOG_PROVIDER; ProviderGuid =
{FD4F53E0-65DC-11d1-AB64-00C04FD9159E}; Path = %systemroot%\system32\wbem\ntevt.dll |
The
same event in XML format:
XMLCopy
<Event xmlns="http://schemas.microsoft.com/win/2004/08/events/event">
<System>
<Provider Name="Microsoft-Windows-WMI-Activity" Guid="{1418ef04-b0b4-4623-bf7e-d74ab47bbdaa}"/>
<EventID>12</EventID>
<Version>0</Version>
<Level>4</Level>
<Task>0</Task>
<Opcode>0</Opcode>
<Keywords>0x8000000000000000</Keywords>
<TimeCreated SystemTime="2023-05-05T13:09:18.8438242Z"/>
<EventRecordID>120</EventRecordID>
<Correlation ActivityID="{2a353ead-0000-0000-0000-256f9de5fabd}"/>
<Execution ProcessID="2752" ThreadID="4348"/>
<Channel>Microsoft-Windows-WMI-Activity/Trace</Channel>
<Computer>21H2W10M.contoso.com</Computer>
<Security UserID="S-1-5-21-0000000000-0000000000-00000000-1103"/>
</System>
<UserData>
<Operation_Provider_Info_New
xmlns="http://manifests.microsoft.com/win/2006/windows/WMI">
<GroupOperationId>28096</GroupOperationId>
<Operation>Provider::CreateInstanceEnum
- MS_NT_EVENTLOG_PROVIDER : Win32_NTLogEvent</Operation>
<HostId>556</HostId>
<ProviderName>MS_NT_EVENTLOG_PROVIDER</ProviderName>
<ProviderGuid>{FD4F53E0-65DC-11d1-AB64-00C04FD9159E}</ProviderGuid>
<Path>%systemroot%\system32\wbem\ntevt.dll</Path>
</Operation_Provider_Info_New>
</UserData>
<RenderingInfo Culture="en-US">
<Message>ProviderInfo for
GroupOperationId = 28096; Operation = Provider::CreateInstanceEnum -
MS_NT_EVENTLOG_PROVIDER : Win32_NTLogEvent; HostID = 556; ProviderName =
MS_NT_EVENTLOG_PROVIDER; ProviderGuid = {FD4F53E0-65DC-11d1-AB64-00C04FD9159E};
Path = %systemroot%\system32\wbem\ntevt.dll</Message>
<Level>Information</Level>
<Task/>
<Opcode>Info</Opcode>
<Channel/>
<Provider>Microsoft-Windows-WMI-Activity</Provider>
<Keywords/>
</RenderingInfo>
</Event>
From
the operation output of the second example, you can get and understand the
following information:
·
Operation
CreateInstanceEnum is initiated on behalf of the user with SID:
UserID="S-1-5-21-0000000000-0000000000-00000000-1103"
·
On 2023-05-05 at 13:09
·
Exact operation: Provider::CreateInstanceEnum
- MS_NT_EVENTLOG_PROVIDER : Win32_NTLogEvent
·
Host ID: 556
·
Provider name: MS_NT_EVENTLOG_PROVIDER
·
Provider path: %systemroot%\system32\wbem\ntevt.dll
Find the client PIDs that causing high CPU
usage
The
idea of reviewing this log file is to list the operations associated with the
identified WmiPrvse.exe PID that's consuming high CPU usage,
understand the incoming queries, and who's initiating them (the client
process).
In
the example covered above, it's the PID 552 that is causing high CPU usage.
From
the second example of the log output, the operation CreateInstanceEnum is
initiated for specific WMI class Win32_NTLogEvent.
For
more information, see Win32_NTLogEvent,
which includes the WMI provider details that are associated with the WMI class.
You
now know the exact WMI provider hosted (MS_NT_EVENTLOG_PROVIDER) in the WmiPrvse.exe that's
causing high CPU usage, the host ID (552), and WMI class (Win32_NTLogEvent)
that's being queried by some client process.
Depending
on the tool that you're using to review the trace files, you may apply
necessary filters to review just the operations related to Win32_NTLogEvent or WmiPrvse.exe PID 552
or Host ID 552 or ntevt.dll.
With
the filter showing only the lines or operations that include
"Win32_NTLogEvent", the results are:
|
Level |
Source |
Event ID |
Description |
|
Information |
Microsoft-Windows-WMI-Activity |
11 |
CorrelationId = {345E5566-0000-0000-0000-68343241D901};
GroupOperationId = 30641; OperationId = 30642; Operation = Start
IWbemServices::CreateInstanceEnum - root\cimv2 : Win32_NTLogEvent;
ClientMachine = 21H2W10M; User = CONTOSO\<UserName>; ClientProcessId =
5484; NamespaceName = 133277000000783520 |
|
Information |
Microsoft-Windows-WMI-Activity |
12 |
ProviderInfo for GroupOperationId = 30641; Operation =
Provider::CreateInstanceEnum - MS_NT_EVENTLOG_PROVIDER : Win32_NTLogEvent;
HostID = 556; ProviderName = MS_NT_EVENTLOG_PROVIDER; ProviderGuid =
{FD4F53E0-65DC-11d1-AB64-00C04FD9159E}; Path = %systemroot%\system32\wbem\ntevt.dll |
|
Information |
Microsoft-Windows-WMI-Activity |
11 |
CorrelationId = {345E5566-0000-0000-0000-68343241D901};
GroupOperationId = 30697; OperationId = 30698; Operation = Start
IWbemServices::CreateInstanceEnum - root\cimv2 : Win32_NTLogEvent;
ClientMachine = 21H2W10M; User = CONTOSO\<UserName>; ClientProcessId =
5484; NamespaceName = 133277000000783520 |
|
Information |
Microsoft-Windows-WMI-Activity |
12 |
ProviderInfo for GroupOperationId = 30697; Operation =
Provider::CreateInstanceEnum - MS_NT_EVENTLOG_PROVIDER : Win32_NTLogEvent;
HostID = 556; ProviderName = MS_NT_EVENTLOG_PROVIDER; ProviderGuid =
{FD4F53E0-65DC-11d1-AB64-00C04FD9159E}; Path = %systemroot%\system32\wbem\ntevt.dll |
From
the above operations, you can get the following additional information:
·
Timestamp
·
Operation ID: 30642;
·
The exact operation
= Start
IWbemServices::CreateInstanceEnum - root\cimv2 : Win32_NTLogEvent;
·
Client Machine = 21H2W10M
·
User =
CONTOSO\<UserName>
·
PID of Client that has
initiated the query: 5484
At
last, you have the PID of a client process 5484, that's initiating a query
to Win32_NTLogEvent. That's handled by provider MS_NT_EVENTLOG_PROVIDER and hosted under WmiPrvse.exe PID
552, which causes high CPU usage.
Once
you have narrowed down the client PIDs, use one of the following tools to find
the process name.
·
WMIMon
More information on WmiMon
WMImon.exe is
a powerful monitoring tool that allows for the tracking and monitoring of
system events and the resource usage of the WMI service.
It
serves the important function of identifying the WMI calls and queries made by
other processes, as well as providing information on query frequency, the user account
used for the queries, and the requested information.
This
data can be useful for system administrators who need to troubleshoot
performance issues.
To
collect and analyze this data, you can follow the step-by-step instructions:
1. Identify the PID of the WmiPrvSE.exe that's
consuming the CPU usage using the methods described above.
2. Download the WMIMon.exe tool
from GitHub - luctalpe/WMIMon.
The tool is to monitor WMI activity on Windows.
3. Extract the contents of the WMIMon_Binaries.zip file
to a folder on your computer.
4. Open a command prompt as an administrator and
go to the folder where you extracted the WMIMon files.
5. Execute the WMIMon.exe file
by entering WMIMon.exe in the command
prompt and pressing Enter.
6. WMIMon will now start monitoring the WMI calls
made by processes on the system, including the one identified in step 1.
7. WMIMon displays information such as the client
process ID, the WMI namespace called by the operation, the WMI class name, and
the user account used to make the request.
8. Analyze the output from WMIMon to identify
which process(es) is making frequent WMI calls and potentially causing high CPU
usage.
By
following these steps, you can effectively use WMIMon.exe to
monitor WMI activity on your system and identify any performance or security
issues caused by excessive WMI usage.
Here's
an example:
Note
You can export the
data captured by WMIMon to a text file by executing the WMIMon.exe > Data.txt command in the command prompt. To stop
the data capture, press Ctrl + C.
There
may be tricky situations where narrowing down a specific client PID,
application, or EXE is impossible. In such cases, considering a common entity
such as a user name or machine associated may be useful.
That
is, understand if the user initiating the query is a service account or
associated with a specific application.
Other solutions
Once
you finalize the suspect, you may consider temporarily disabling its service or
uninstalling the application associated with it and checking if the high CPU
usage issue gets solved.
Here
are some scenarios where disabling it can validate your observations.
·
Monitoring
applications and services
·
System center
configuration manager (SCCM) (policyhost.exe or Monitoringhost.exe)
·
Powershell.exe running scripts containing WMI queries
·
Any third-party
application
Data collection
If
you need assistance from Microsoft support, we recommend you collect the
information by following the steps mentioned in Gather
information by using TSS for User Experience issues.
You
can also gather information by using the WMI-Collect tool. Here are the steps:
1.
Download WMI-Collect.zip and extract it in a
folder, such as C:\temp.
2.
From an elevated
PowerShell command prompt, run the WMI-Collect.ps1 script from
the folder where the script is saved. For example:
PowerShellCopy
C:\temp\WMI-Collect.ps1 -Logs -Trace -Activity -Kernel -WPR -PerfMonWMIPrvSE
Note
·
Keep the PowerShell
command prompt open with the "Press ENTER to stop the capture:"
message, and make sure the WmiPrvse.exe process or the WMI
service high CPU usage issue is reproduced.
·
Don't keep the tracing
enabled for more than one minute.
3.
Stop the tracing by
pressing Enter.
The
script will create a subfolder containing the results of all traces and the
diagnostic information. Compress the folder. After a support case is created,
this file can be uploaded to the secure workspace for analysis.
Reference